Market Outlook
October 25, 2017
Market Cues
Domestic Indices
Chg (%)
(Pts)
(Close)
Indian markets are likely to open Positive tracking global indices and SGX Nifty.
BSE Sensex
0.3
101
32,607
U.S. stocks closed higher on Tuesday, with the Dow ending in record territory,
Nifty
0.2
23
10,208
supported by earnings results that continued to come in ahead of expectations. Both
Mid Cap
0.2
34
16,182
Caterpillar and 3M boosted the blue-chip average’s advance, while broader gains
Small Cap
0.6
95
17,192
were limited by declines in health-care shares. The Dow Jones Industrial Average
DJIA, rose 0.7%, to close at 23,442, marking its 54th record close of 2017. The
Bankex
0.6
168
27,055
S&P 500 SPX, added 0.2%, to end at 2,569, While the NASDAQ Composite COMP,
gained 0.2%, to 6,598.
Global Indices
Chg (%)
(Pts)
(Close)
U.K. stocks closed with a tiny gain on Tuesday, with shares of Whitbread PLC
Dow Jones
0.7
167
23,442
keeping a lid on gains after the company’s earnings report sparked concerns about
Nasdaq
0.2
12
6,598
its coffee chain Costa. The FTSE 100 index UKX, rose less than 0.1% to end at
FTSE
0.1
10
7,527
7,527, delivering a third straight session featuring a move smaller than 0.1%.
Nikkei
0.5
109
21,805
Hang Seng
(0.5)
(151)
28,155
ON Domestic Front, Earnings optimism helped push Indian shares higher for a
second consecutive session on Tuesday, although muted cues from Europe served to
Shanghai Com
0.2
8
3,388
limit overall gains in the broader market. The 30-share Sensex closed higher by
0.31% at 32,607, while the 50-share Nifty index finished up by 0.22% at 10,207.
Advances / Declines
BSE
NSE
Advances
1,462
963
News Analysis
Declines
1,323
761
Infosys - 2QFY18 result update
Unchanged
129
77
Economy to get ₹7,00,000-crore stimulus
Detailed analysis on Pg2
Volumes (` Cr)
BSE
3,779
Investor’s Ready Reckoner
NSE
29,463
Key Domestic & Global Indicators
Stock Watch: Latest investment recommendations on 150+ stocks
Net Inflows (` Cr)
Net
Mtd
Ytd
Refer Pg5 onwards
FII
(1,120)
(5,606)
30,924
Top Picks
MFs
947
6,413
92,756
CMP
Target
Upside
Company
Sector
Rating
(`)
(`)
(%)
Blue Star
Capital Goods Accumulate
809
867
7.1
Top Gainers
Price (`)
Chg (%)
Dewan Housing Finance
Financials
Accumulate
597
670
12.3
Jetairways
512
9.0
Asian Granito
Other
Buy
492
570
15.8
Sci
96
7.9
Navkar Corporation
Other
Buy
198
265
34.0
Ncc
101
7.3
KEI Industries
Capital Goods
Buy
317
380
19.8
More Top Picks on Pg4
Syndibank
72
7.1
Andhrabank
59
7.0
Key Upcoming Events
Previous
Consensus
Date
Region
Event Description
Reading
Expectations
Top Losers
Price (`)
Chg (%)
Oct 25
US
New home sales
560.00
554.50
Ghcl
230
(8.1)
Oct 25
UK
GDP (YoY)
1.50
1.50
Havells
505
(6.8)
Oct 26
US
Initial Jobless claims
222.00
235.00
Oct 26
Euro Zone Euro-Zone Consumer Confidence
(1.00)
Bajajelec
388
(4.2)
Oct 27
Euro Zone ECB announces interest rates
-
-
Religare
43
(4.1)
More Events on Pg7
Unitech
6
(4.1)
As on October, 23 2017
Market Outlook
October 25, 2017
News Analysis
Infosys - 2QFY18 result update
Infosys is slated to announce its 2QFY2018 results today. We expect the company
to post 3.1% sequential growth in USD revenues to US$2,755mn. In rupee terms,
revenues are expected to come in at `17,604cr, up 3.1% qoq. EBIT margin is
expected to show a dip of ~48bp qoq to end the period at 23.6%. Consequently,
PAT is expected to be at `3,590cr, a rise of 1.6% qoq. We maintain our buy rating
on the stock with a target price of `1,179.
Y/E
Sales OPM
PAT
EPS ROE P/E P/BV EV/EBITDA EV/Sales
March
(` cr)
(%)
(` cr)
(`)
(%)
(x)
(x)
(x)
(x)
FY2018E
73,963
26.0
14,785
64.4
19.7
13.8
2.7
9.5
2.5
FY2019E
80,619
26.0
15,916
69.3
19.6
12.8
2.5
8.5
2.2
Economy to get ₹7,00,000-crore stimulus
Amidst concerns over growth slowdown, the government on Tuesday
announced ambitious plans for bank capitalization to boost the economy spur
investments and create jobs, as well as a highway construction project.
Stressing that the macro fundamentals of the economy are strong, Finance
Minister Arun Jaitley announced the ₹5.35 lakh cr BharatMala Pariyojana to
construct
34,800 km of highways and an aggressive
₹2.11 lakh cr
capitalisation plan for public sector banks. The decisions were taken at Union
Cabinet meeting earlier in the day.
The government will pump in `1.35 lakh cr of this recapitalisation through
bonds. Whether this would have a bearing on the fiscal deficit or not will
depend on the contours of the bond, which are still to be decided. Another Rs
76,000 crore will come from budgetary support and banks tapping the
market. While `18,000cr will come from the government’s recapitalisation
plan under Indradhanush, banks will raise the remaining `58,000cr from the
market by diluting government equity.
Economic and Political News
GST: Govt collects ₹ 92,150 crore revenue in September
Mr.Prabhu to discuss trade issues with US Congress
Govt hikes wheat MSP by Rs 110/qtl; pulses, Rs 200/qtl to check prices
Corporate News
Lupin got U.S. FDA approval for generic Lodosyn Tablets.
RCom to shut down DTH business next month
Varun Beverages buys two more PepsiCo bottling units
Market Outlook
October 25, 2017
Quarterly Bloomberg Brokers Consensus Estimate
Kotak Mahindra Bank - Oct 25, 2017
Particulars ( `cr)
2QFY18E
2QFY17
y-o-y (%)
1QFY18
q-o-q (%)
PAT
1,478
1,202
22.9
1,346
9.8
Exide Industries Ltd - Oct 25, 2017
Particulars ( ` cr)
2QFY18E
2QFY17
y-o-y (%)
1QFY18
q-o-q (%)
Sales
2,166
1,928
12.3
2,102
3.1
EBIDTA
315
292
7.8
324
(2.8)
%
14.5
15.1
15.4
PAT
189
181
4.4
190
(0.5)
HUL Ltd - Oct 25, 2017
Particulars ( ` cr)
2QFY18E
2QFY17
y-o-y (%)
1QFY18
q-o-q (%)
Sales
8,198
7,843
4.5
8,529
(3.9)
EBIDTA
1,596
1,403
13.7
1,849
(13.7)
%
19.4
17.9
21.7
PAT
1,196
1,095
9.2
1,283
(6.8)
HCL Tech Ltd - Oct 25, 2017
Particulars ( ` cr)
2QFY18E
2QFY17
y-o-y (%)
1QFY18
q-o-q (%)
Sales
12,575
11,519
9.2
12,149
3.5
EBIDTA
2,713
2,533
7.2
2,694
0.8
%
21.5
21.9
22.2
PAT
2,137
2,015
6.1
2,210
(3.3)
IDFC Bank - Oct 25, 2017
Particulars ( `cr)
2QFY18E
2QFY17
y-o-y (%)
1QFY18
q-o-q (%)
PAT
313
387
(19.1)
437
(28.3)
M&M Financial Services - Oct 25, 2017
Particulars ( `cr)
2QFY18E
2QFY17
y-o-y (%)
1QFY18
q-o-q (%)
PAT
128
114
12.2
59
116.1
Market Outlook
October 25, 2017
Top Picks ★★★★★
Market Cap
CMP
Target
Upside
Company
Rationale
(` Cr)
(`)
(`)
(%)
Strong growth in domestic business due to its leade`hip
in acute therapeutic segment. Alkem expects to launch
Alkem Laboratories
22,250
1,861
2,079
11.7
more products in USA, which bodes for its international
business.
We expect the company would report strong profitability
Asian Granito
1,481
492
570
15.8
owing to better product mix, higher B2C sales and
amalgamation synergy.
Favorable outlook for the AC industry to augur well for
Cooling products business which is out pacing the
Blue Star
7,750
809
867
7.1
market growth. EMPPAC division's profitability to
improve once operating environment turns around.
With a focus on the low and medium income (LMI)
consumer segment, the company has increased its
Dewan Housing Finance
18,708
597
670
12.3
presence in tier-II & III cities where the growth
opportunity is immense.
Loan growth is likely to pick up after a sluggish FY17.
Lower credit cost will help in strong bottom-line growth.
Karur Vysya Bank
7,702
127
180
41.2
Increasing share of CASA will help in NIM
improvement.
High order book execution in EPC segment, rising B2C
KEI Industries
2,469
317
380
19.8
sales and higher exports to boost the revenues and
profitability
Expected to benefit from the lower capex requirement
Music Broadcast
2,175
381
434
13.9
and 15 year long radio broadcast licensing.
Massive capacity expansion along with rail advantage
Navkar Corporation
2,819
198
265
34.0
at ICD as well CFS augur well for the company
Strong brands and distribution network would boost
Siyaram Silk Mills
2,617
2,792
2,982
6.8
growth going ahead. Stock currently trades at an
inexpensive valuation.
Market leaderhip in Hindi news genre and no.
2
viewe`hip ranking in English news genre, exit from the
TV Today Network
2,080
349
435
24.7
radio business, and anticipated growth in ad spends by
corporates to benefit the stock.
After GST, the company is expected to see higher
volumes along with improving product mix. The Gujarat
Maruti Suzuki
2,37,899
7,875
8,658
9.9
plant will also enable higher operating leverage which
will be margin accretive.
We expect loan book to grow at 24.3% over next two
GIC Housing
2,675
497
655
31.8
year; change in borrowing mix will help in NIM
improvement..
Source: Company, Angel Research
Market Outlook
October 25, 2017
Key Upcoming Events
Result Calendar
Date
Company
October 25, 2017
Exide Industries, Kotak Mahindra Bank, HUL , HCL Tech, Mindtree, NIIT, GSK PHarma
October 26, 2017
Cummins India, Yes Bank, Vijaya Bank, Mphasis
Source: Bloomberg, Angel Research
Global economic events release calendar
Bloomberg Data
Date
Time
Country
Event Description
Unit
Period
Last Reported
Estimated
Oct 25, 2017
7:30 PMUS
New home sales
Thousands
Sep
560.00
554.50
2:00 PMUK
GDP (YoY)
% Change
3Q A
1.50
1.50
Oct 26, 2017
6:00 PMUS
Initial Jobless claims
Thousands
Oct 21
222.00
235.00
3:30 PMEuro Zone Euro-Zone Consumer Confidence
Value
Oct F
(1.00)
Oct 27, 2017
5:15 PMEuro Zone ECB announces interest rates
%
Oct 26
-
-
Oct 30, 2017
6:00 PMUS
GDP Qoq (Annualised)
% Change
3Q A
3.10
2.50
Oct 31, 2017
6:30 AMChina
PMI Manufacturing
Value
Oct
52.40
52.10
7:30 PMUS
Consumer Confidence
S.A./ 1985=100
Oct
119.80
121.00
3:30 PMEuro Zone Euro-Zone GDP s.a. (QoQ)
% Change
3Q A
0.70
Nov 01, 2017
3:00 PMUK
PMI Manufacturing
Value
Oct
55.90
11:30 PMUS
FOMC rate decision
%
Nov 1
1.25
1.25
Nov 02, 2017
2:25 PMGermany Unemployment change (000's)
Thousands
Oct
(22.00)
5:30 PMUK
BOE Announces rates
% Ratio
Nov 2
0.25
0.50
Nov 03, 2017
6:00 PMUS
Change in Nonfarm payrolls
Thousands
Oct
(33.00)
308.00
6:00 PMUS
Unnemployment rate
%
Oct
4.20
4.20
Source: Bloomberg, Angel Research
Market Outlook
October 25, 2017
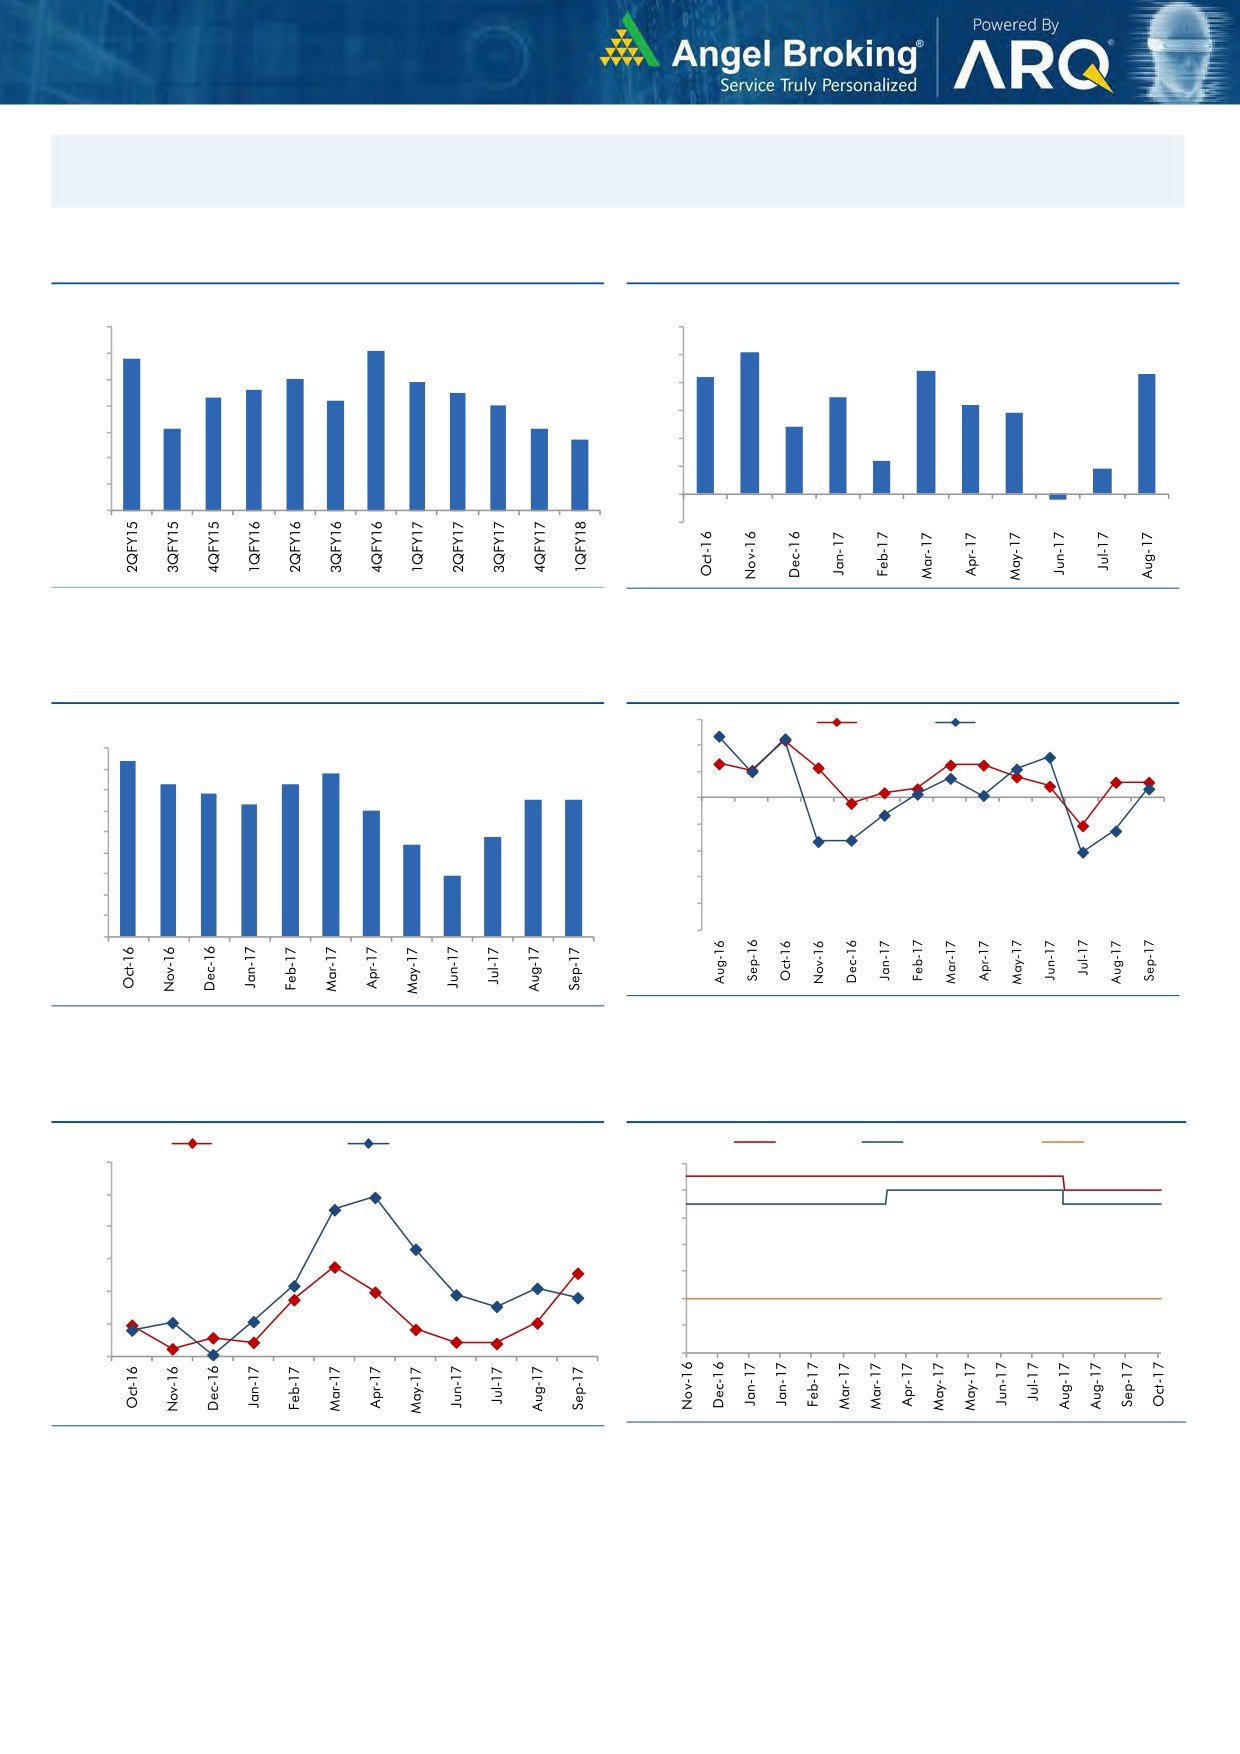
Macro watch
Exhibit 1: Quarterly GDP trends
Exhibit 2: IIP trends
(%)
(%)
10.0
6.0
9.1
5.1
8.8
9.0
5.0
4.4
4.3
8.0
7.9
4.2
7.6
7.5
8.0
7.3
7.2
4.0
3.5
7.0
3.2
2.9
7.0
6.1
6.1
3.0
2.4
5.7
6.0
2.0
1.2
0.9
5.0
1.0
4.0
-
3.0
(1.0)
(0.2)
Source: CSO, Angel Research
Source: MOSPI, Angel Research
Exhibit 3: Monthly CPI inflation trends
Exhibit 4: Manufacturing and services PMI
56.0
Mfg. PMI
Services PMI
(%)
4.5
4.2
54.0
3.9
4.0
3.6
3.7
52.0
3.4
3.2
3.3
3.3
3.5
3.0
50.0
3.0
2.4
48.0
2.5
2.2
2.0
46.0
1.5
1.5
44.0
1.0
42.0
0.5
40.0
-
Source: Market, Angel Research; Note: Level above 50 indicates expansion
Source: MOSPI, Angel Research
Exhibit 5: Exports and imports growth trends
Exhibit 6: Key policy rates
(%)
Exports yoy growth
Imports yoy growth
(%)
Repo rate
Reverse Repo rate
CRR
60.0
6.50
50.0
6.00
5.50
40.0
5.00
30.0
4.50
20.0
4.00
10.0
3.50
0.0
3.00
Source: Bloomberg, Angel Research
Source: RBI, Angel Research
Market Outlook
October 25, 2017
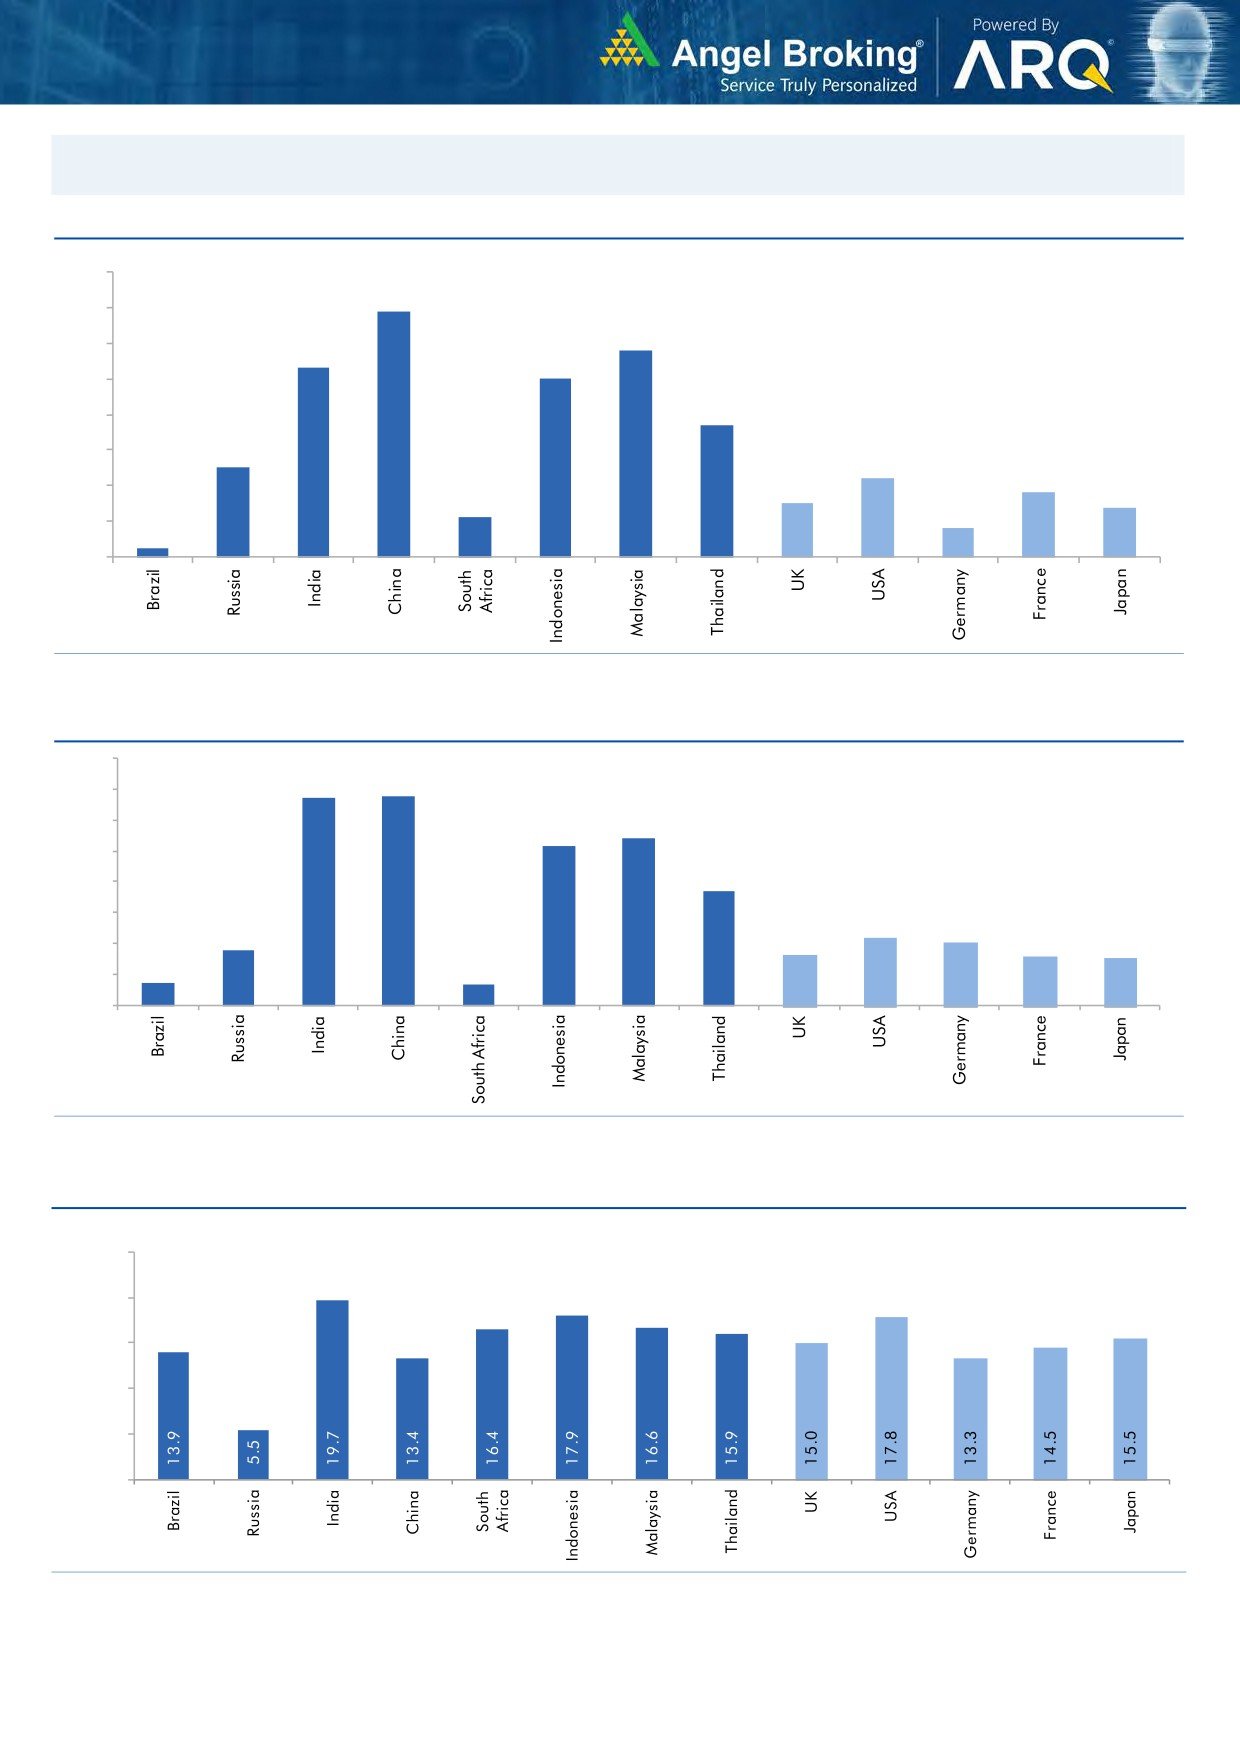
Global watch
Exhibit 1: Latest quarterly GDP Growth (%, yoy) across select developing and developed countries
(%)
8.0
6.9
7.0
5.8
6.0
5.3
5.0
5.0
1.1
3.7
4.0
2.5
3.0
2.2
1.8
2.0
1.5
1.4
0.8
1.0
0.3
-
Source: Bloomberg, Angel Research
Exhibit 2: 2017 GDP Growth projection by IMF (%, yoy) across select developing and developed countries
(%)
6.7
6.8
7.0
6.0
5.4
5.2
5.0
3.7
4.0
3.0
1.8
2.2
2.0
1.7
1.6
1.5
2.0
0.7
0.7
1.0
-
Source: IMF, Angel Research
Exhibit 3: One year forward P-E ratio across select developing and developed countries
(x)
25.0
20.0
15.0
10.0
5.0
-
Source: IMF, Angel Research as on 23 Oct 2017
Market Outlook
October 25, 2017
Exhibit 4: Relative performance of indices across globe
Returns (%)
Country
Name of index
Closing price
1M
3M
1YR
Brazil
Bovespa
75,413
(0.8)
16.6
18.8
Russia
Micex
2,064
0.6
6.7
4.5
India
Nifty
10,185
0.7
3.4
17.3
China
Shanghai Composite
3,381
1.0
4.9
10.6
South Africa
Top 40
51,670
4.0
7.2
14.9
Mexico
Mexbol
49,548
(2.0)
(4.2)
3.0
Indonesia
LQ45
988
0.1
2.2
6.4
Malaysia
KLCI
1,741
(2.0)
(0.8)
4.6
Thailand
SET 50
1,079
1.0
8.5
14.7
USA
Dow Jones
23,274
4.1
8.2
27.7
UK
FTSE
7,524
3.6
2.0
7.2
Japan
Nikkei
21,697
6.8
7.7
28.4
Germany
DAX
13,003
3.4
6.2
21.8
France
CAC
5,387
2.3
4.1
20.9
Source: Bloomberg, Angel Research as on 23 Oct 2017 p68in4
Stock Watch
October 25, 2017
Company Name
Reco
CMP
Target
Mkt Cap
Sales ( Čcr )
OPM(%)
EPS (Č)
PER(x)
P/BV(x)
RoE(%)
EV/Sales(x)
(Č)
Price ( Č)
( Č cr )
FY18E FY19E
FY18E
FY19E
FY18E
FY19E
FY18E
FY19E
FY18E
FY19E
FY18E
FY19E
FY18E
FY19E
Agri / Agri Chemical
Rallis
Sell
252
209
4,904
1,873
2,099
15.0
15.0
9.5
10.5
26.5
24.0
4.0
3.7
15.8
16.0
2.5
2.3
United Phosphorus
Neutral
800
-
40,633
18,922
21,949
18.0
18.5
36.2
45.6
22.1
17.5
4.6
3.8
22.7
23.8
2.3
1.9
Auto & Auto Ancillary
Ashok Leyland
Neutral
128
-
37,577
23,339
27,240
10.1
10.8
4.7
6.2
27.6
20.7
5.5
4.9
20.0
23.6
1.6
1.3
Bajaj Auto
Neutral
3,215
-
93,027
23,936
27,955
19.5
20.1
142.7
167.3
22.5
19.2
4.9
4.4
21.8
22.8
3.5
2.9
Bharat Forge
Buy
638
875
29,686
7,637
8,755
21.7
23.2
36.1
47.3
17.7
13.5
3.2
2.7
18.5
20.8
3.7
3.2
Eicher Motors
Neutral
31,483
-
85,706
19,043
22,837
19.5
19.9
835.4
1,019.0
37.7
30.9
14.1
10.9
40.9
37.8
4.4
3.6
Gabriel India
Neutral
201
-
2,890
1,782
2,033
9.7
10.2
7.1
8.9
28.3
22.7
5.7
4.8
21.0
22.2
1.6
1.4
Hero Motocorp
Accumulate
3,760
4,129
75,087
32,239
36,878
16.0
15.6
184.4
206.5
20.4
18.2
6.4
5.6
31.3
30.7
2.1
1.8
Jamna Auto Industries Neutral
59
-
2,349
1,441
1,662
14.4
14.8
13.9
17.6
4.2
3.4
1.2
0.9
30.0
31.0
1.6
1.4
Mahindra and Mahindra Neutral
1,353
-
84,003
46,971
53,816
13.6
14.0
67.7
79.8
20.0
17.0
2.9
2.5
15.0
15.9
1.7
1.4
Maruti
Accumulate
7,875
8,658
237,899
81,825
101,245
15.0
15.0
283.5
356.0
27.8
22.1
6.1
4.9
21.9
22.4
2.6
2.0
Minda Industries
Neutral
824
-
7,118
4,328
5,084
11.0
11.9
27.3
36.4
30.2
22.6
6.4
5.0
23.1
25.6
1.7
1.5
Motherson Sumi
Neutral
358
-
75,281
55,937
64,445
10.8
11.4
16.9
21.1
21.2
17.0
4.7
4.8
25.2
25.4
1.4
1.2
Tata Motors
Neutral
416
-
120,056
303,167
343,649
11.8
13.8
33.1
54.7
12.6
7.6
2.1
1.6
16.9
23.0
0.4
0.4
TVS Motor
Neutral
694
-
32,964
13,992
16,216
9.0
9.4
17.1
20.3
40.7
34.2
10.8
8.4
29.7
27.7
2.3
1.9
Amara Raja Batteries
Buy
701
858
11,967
6,140
7,122
14.3
15.6
29.3
39.0
23.9
18.0
4.1
3.4
17.1
19.0
2.0
1.7
Exide Industries
Neutral
208
-
17,663
8,689
9,854
15.1
15.2
9.7
11.0
21.5
18.9
3.8
3.4
15.7
16.1
1.8
1.5
Apollo Tyres
Neutral
240
-
12,232
15,739
17,326
13.3
14.6
20.4
26.7
11.8
9.0
1.4
1.3
20.4
26.7
1.0
0.9
Ceat
Neutral
1,678
-
6,788
6,661
7,717
11.1
14.2
116.2
178.2
14.5
9.4
2.5
2.1
15.2
21.3
1.1
1.0
JK Tyres
Neutral
146
-
3,313
8,318
9,239
16.2
16.4
21.0
27.5
7.0
5.3
1.4
1.1
19.1
20.4
0.8
0.7
Swaraj Engines
Neutral
2,032
-
2,524
788
889
16.4
16.5
71.6
81.0
28.4
25.1
8.2
7.6
29.6
31.0
2.9
2.5
Subros
Neutral
257
-
1,542
1,855
2,135
11.6
11.8
10.3
14.7
25.1
17.6
3.8
3.3
15.8
19.1
1.0
0.9
Capital Goods
BEML
Neutral
1,738
-
7,237
4,286
5,194
7.1
8.2
42.9
58.1
40.5
29.9
3.3
3.0
7.6
8.7
1.7
1.4
Bharat Electronics
Neutral
175
-
42,997
10,258
12,470
19.6
19.5
7.3
8.6
24.0
20.4
0.5
0.4
20.4
21.9
3.7
3.0
Voltas
Neutral
539
-
17,821
6,778
8,004
9.6
11.0
17.1
22.4
31.5
24.0
7.5
6.6
17.7
19.8
2.3
2.0
BHEL
Neutral
88
-
32,290
33,200
39,167
6.8
9.5
6.2
11.2
14.2
7.9
0.7
0.6
4.6
8.0
0.5
0.4
Blue Star
Accumulate
809
867
7,750
5,220
6,207
6.3
6.6
16.8
22.3
48.2
36.3
9.6
8.5
19.9
23.3
1.5
1.2
CG Power and Industrial
Neutral
81
-
5,080
6,555
7,292
7.5
7.5
-
0.8
8,105.0
101.3
1.3
1.3
0.1
1.2
0.9
0.8
Solutions
Greaves Cotton
Neutral
129
-
3,158
1,778
1,993
14.7
15.1
8.1
9.1
16.0
14.2
3.6
3.4
21.8
23.6
1.5
1.4
Stock Watch
October 25, 2017
Company Name
Reco
CMP
Target
Mkt Cap
Sales ( Čcr )
OPM(%)
EPS (Č)
PER(x)
P/BV(x)
RoE(%)
EV/Sales(x)
(Č)
Price ( Č)
( Č cr )
FY18E FY19E
FY18E
FY19E
FY18E
FY19E
FY18E
FY19E
FY18E
FY19E
FY18E
FY19E
FY18E
FY19E
Capital Goods
KEC International
Buy
295
350
7,596
9,779
11,113
9.4
9.8
14.2
18.2
20.8
16.2
4.0
3.3
21.1
22.1
1.0
0.9
KEI Industries
Buy
318
380
2,471
3,001
3,391
10.0
10.0
13.0
16.1
24.4
19.7
4.4
3.7
18.2
18.7
1.0
0.9
Thermax
Neutral
967
-
11,520
4,125
4,747
10.3
10.8
26.7
31.5
36.2
30.7
4.1
3.7
11.2
12.0
2.5
2.2
VATech Wabag
Accumulate
599
681
3,269
3,867
4,126
9.6
10.0
34.9
39.8
17.2
15.0
2.8
2.4
17.7
17.5
0.9
0.8
Cement
ACC
Neutral
1,778
-
33,385
12,255
13,350
13.5
14.3
58.0
66.2
30.7
26.9
3.6
3.4
11.5
12.2
2.7
2.5
Ambuja Cements
Neutral
282
-
56,045
10,250
11,450
17.5
19.0
7.2
8.3
39.2
34.0
2.8
2.7
7.0
7.8
5.2
4.6
India Cements
Neutral
182
-
5,622
6,135
6,750
14.8
15.2
8.5
11.5
21.5
15.9
1.1
1.0
4.8
6.2
1.3
1.1
JK Cement
Neutral
981
-
6,861
4,150
4,775
19.2
20.0
49.0
63.5
20.0
15.5
3.2
2.7
17.0
18.5
2.1
1.8
J K Lakshmi Cement
Neutral
417
-
4,909
3,422
3,757
15.5
17.0
13.5
23.2
30.9
18.0
3.2
2.8
10.8
15.5
1.8
1.6
Orient Cement
Neutral
158
-
3,246
2,215
3,233
16.8
17.0
5.9
6.9
26.9
23.0
2.1
1.9
10.8
10.1
2.5
1.6
UltraTech Cement
Neutral
4,211
-
115,612
28,250
35,150
20.2
23.5
77.5
122.2
54.3
34.5
4.6
4.2
9.6
14.8
4.6
3.6
Construction
KNR Constructions
Neutral
225
-
3,160
1,846
2,203
14.5
14.5
12.1
13.7
18.6
16.5
1.0
0.9
17.5
16.7
1.8
1.5
Larsen & Toubro
Neutral
1,140
-
159,662
95,787
109,476
10.2
11.6
44.5
50.8
25.7
22.5
3.2
3.0
12.9
13.1
2.2
2.0
Gujarat Pipavav Port
Neutral
140
-
6,751
739
842
61.6
62.7
5.1
6.2
27.4
22.7
3.4
3.3
12.7
14.9
8.6
7.4
PNC Infratech
Neutral
171
-
4,383
2,040
2,935
13.0
13.0
6.4
9.0
26.7
19.0
0.7
0.6
9.7
12.2
2.1
1.5
Simplex Infra
Neutral
467
-
2,310
6,012
6,619
11.6
11.7
21.1
31.0
22.2
15.1
1.5
1.4
6.5
8.6
0.9
0.8
Sadbhav Engineering
Neutral
292
-
5,010
3,823
4,426
10.7
10.8
10.3
11.8
28.4
24.8
3.4
3.0
10.1
10.5
1.6
1.4
NBCC
Neutral
260
-
23,409
9,099
12,706
6.4
6.4
7.3
9.6
35.7
27.2
1.6
1.2
27.5
30.5
2.4
1.8
MEP Infra
Neutral
97
-
1,577
2,403
2,910
18.3
16.8
2.4
6.1
41.2
16.0
15.7
10.5
35.2
55.8
1.8
1.5
SIPL
Neutral
99
-
3,491
2,060
2,390
46.8
47.7
(5.8)
(3.1)
3.7
4.2
(14.2)
(2.3)
6.5
6.0
Engineers India
Neutral
152
-
10,243
1,795
2,611
21.1
22.4
5.9
8.1
25.8
18.8
1.8
1.8
12.9
16.1
4.1
2.6
Financials
Axis Bank
Buy
452
580
108,335
32,558
35,843
3.5
3.2
27.8
41.0
16.3
11.0
1.8
1.5
11.4
14.9
-
-
Bank of Baroda
Neutral
143
-
32,984
22,533
26,079
2.4
2.4
12.0
20.9
11.9
6.9
0.8
0.7
6.6
11.0
-
-
Canara Bank
Neutral
317
-
18,946
17,925
20,235
2.0
2.1
18.5
36.5
17.2
8.7
0.7
0.6
3.4
6.2
-
-
Can Fin Homes
Buy
539
2,128
7,173
586
741
3.5
3.5
107.8
141.0
5.0
3.8
1.1
0.9
24.1
25.6
-
-
Cholamandalam Inv. &
Accumulate
1,170
1,230
18,287
2,826
3,307
6.3
6.3
53.7
64.6
21.8
18.1
3.7
3.2
18.3
18.9
-
-
Fin. Co.
Dewan Housing Finance Accumulate
597
670
18,708
2,676
3,383
2.4
2.7
37.4
49.7
16.0
12.0
2.1
1.8
13.8
16.2
-
-
Equitas Holdings
Buy
153
235
5,177
1,125
1,380
9.6
9.8
1.5
6.0
101.9
25.5
2.3
2.2
2.4
8.2
-
-
Federal Bank
Neutral
125
-
24,273
4,896
5,930
2.8
3.1
5.4
7.6
23.2
16.5
2.0
1.8
8.5
11.0
-
-
Stock Watch
October 25, 2017
Company Name
Reco
CMP
Target
Mkt Cap
Sales ( Čcr )
OPM(%)
EPS (Č)
PER(x)
P/BV(x)
RoE(%)
EV/Sales(x)
(Č)
Price ( Č)
( Č cr )
FY18E FY19E
FY18E
FY19E
FY18E
FY19E
FY18E
FY19E
FY18E
FY19E
FY18E
FY19E
FY18E
FY19E
Financials
GIC Housing
Buy
497
655
2,675
376
477
3.6
3.7
33.0
40.0
15.1
12.4
2.7
2.3
20.0
23.0
-
-
HDFC Bank
Neutral
1,865
-
481,469
55,236
63,253
4.5
4.4
68.9
82.4
27.1
22.6
4.7
3.9
18.7
18.5
-
-
ICICI Bank
Buy
266
315
170,958
42,361
51,378
3.6
3.9
18.4
25.7
14.5
10.4
1.6
1.5
11.3
15.0
-
-
Karur Vysya Bank
Buy
127
180
7,702
3,289
3,630
3.7
3.9
10.8
14.1
11.8
9.1
1.4
1.3
12.5
14.7
-
-
LIC Housing Finance
Neutral
634
-
31,980
4,895
6,332
3.4
3.7
50.7
66.8
12.5
9.5
2.5
2.1
21.7
23.8
-
-
Punjab Natl.Bank
Neutral
138
-
29,387
23,708
25,758
2.1
2.1
5.9
16.4
23.5
8.4
0.7
0.7
3.0
8.3
-
-
RBL Bank
Neutral
536
-
22,150
2,309
2,888
2.6
2.5
16.4
19.1
32.8
28.1
4.1
3.7
13.3
13.8
-
-
Repco Home Finance
Buy
649
825
4,060
496
597
4.4
4.2
38.5
48.7
16.9
13.3
3.0
2.5
19.6
20.6
-
-
South Ind.Bank
Neutral
32
-
5,783
3,195
3,567
3.0
3.1
3.0
3.8
10.6
8.4
1.1
0.9
10.5
11.9
-
-
St Bk of India
Neutral
255
-
219,686
105,827
121,056
2.4
2.5
16.1
25.6
15.8
10.0
1.2
1.1
6.6
9.9
-
-
Union Bank
Neutral
131
-
9,542
14,650
16,225
2.3
2.3
23.1
32.5
5.7
4.0
0.4
0.4
7.1
9.2
-
-
Yes Bank
Neutral
348
-
79,754
11,088
13,138
3.0
2.9
84.0
99.3
4.2
3.5
0.6
0.6
16.3
16.8
-
-
FMCG
Akzo Nobel India
Neutral
1,840
-
8,825
3,164
3,607
13.8
13.7
58.6
67.9
31.4
27.1
7.7
6.8
24.5
25.1
2.6
2.3
Asian Paints
Neutral
1,221
-
117,070
17,603
20,615
18.6
18.6
2,128.9
2,543.3
0.6
0.5
12.1
10.2
28.0
28.9
6.4
5.4
Britannia
Neutral
4,627
-
55,545
9,690
11,278
14.8
15.4
84.0
101.0
55.1
45.8
20.1
16.0
40.6
39.0
5.7
4.9
Colgate
Neutral
1,057
-
28,748
4,420
5,074
24.9
25.3
28.6
32.8
37.0
32.2
14.6
11.8
43.8
40.5
6.3
5.4
Dabur India
Neutral
318
-
56,096
8,346
9,344
19.6
19.9
7.8
9.0
40.8
35.4
8.2
7.4
25.2
24.8
6.3
5.6
GlaxoSmith Con*
Neutral
4,936
-
20,760
5,072
5,760
18.2
18.4
176.3
199.2
28.0
24.8
5.9
5.4
21.2
21.7
3.4
3.0
Godrej Consumer
Neutral
933
-
63,537
10,171
11,682
20.8
21.5
21.7
27.1
43.0
34.4
9.7
8.3
22.3
23.4
6.4
5.5
HUL
Neutral
1,271
-
275,159
37,077
41,508
20.3
21.8
5,189.9
6,318.5
0.2
0.2
38.8
33.1
74.8
82.0
7.3
6.5
ITC
Neutral
267
-
325,336
44,588
49,853
37.0
37.3
9.6
11.0
27.8
24.3
6.8
6.5
25.1
27.3
6.8
6.0
Marico
Neutral
313
-
40,379
6,788
7,766
18.5
19.2
7.1
8.5
44.1
36.8
15.4
13.2
36.9
38.0
5.8
5.0
Nestle*
Neutral
7,244
-
69,839
10,083
11,182
20.0
20.9
119.7
141.3
60.5
51.3
213.3
194.9
36.7
39.8
6.6
5.9
Tata Global
Neutral
210
-
13,232
7,121
7,641
11.9
12.3
6.9
8.0
30.4
26.2
2.0
1.9
6.8
7.2
1.7
1.5
Procter & Gamble
Neutral
8,630
-
28,014
3,034
3,579
27.1
27.7
167.7
198.8
51.5
43.4
13.8
11.9
28.8
29.5
8.7
7.2
Hygiene
IT
HCL Tech^
Accumulate
913
1,014
130,348
52,342
57,053
20.9
20.9
62.8
67.6
14.6
13.5
3.3
2.8
22.4
20.6
2.2
1.9
Infosys
Buy
927
1,179
212,874
73,963
80,619
26.0
26.0
64.4
69.3
14.4
13.4
2.8
2.6
19.7
19.6
2.3
2.1
TCS
Neutral
2,581
-
508,489
127,403
138,870
27.6
27.6
144.5
156.0
17.9
16.5
5.3
4.9
29.7
29.8
3.7
3.3
Tech Mahindra
Buy
455
533
44,389
31,015
33,496
15.0
15.0
35.6
38.1
12.8
11.9
2.2
2.0
17.0
16.3
1.2
1.0
Stock Watch
October 25, 2017
Company Name
Reco
CMP
Target
Mkt Cap
Sales ( Čcr )
OPM(%)
EPS (Č)
PER(x)
P/BV(x)
RoE(%)
EV/Sales(x)
(Č)
Price ( Č)
( Č cr )
FY18E FY19E
FY18E
FY19E
FY18E
FY19E
FY18E
FY19E
FY18E
FY19E
FY18E
FY19E
FY18E
FY19E
IT
Wipro
Neutral
296
-
144,200
58,536
61,858
20.3
20.3
18.2
19.1
16.3
15.5
2.5
2.2
14.6
13.4
2.4
2.3
Media
D B Corp
Neutral
368
-
6,777
2,404
2,625
30.5
31.5
23.7
26.9
15.6
13.7
3.7
3.1
23.5
22.8
2.7
2.4
HT Media
Neutral
103
-
2,389
2,589
2,830
15.1
15.4
8.3
10.9
12.4
9.4
1.0
0.9
8.4
10.4
0.5
0.3
Jagran Prakashan
Buy
177
225
5,781
2,541
2,835
28.5
28.7
12.7
14.1
13.9
12.5
2.9
2.5
21.3
21.4
2.1
1.8
Sun TV Network
Neutral
804
-
31,696
3,238
3,789
51.9
55.1
30.9
38.0
26.0
21.2
7.4
6.5
30.0
31.0
9.3
7.8
Hindustan Media
Neutral
240
-
1,760
1,002
1,074
23.3
23.5
29.2
33.8
8.2
7.1
1.3
1.1
15.6
15.4
0.8
0.5
Ventures
TV Today Network
Buy
349
435
2,080
667
727
27.7
27.7
18.6
20.1
18.8
17.4
2.9
3.0
15.6
17.3
2.6
2.5
Music Broadcast Limited Accumulate
381
434
2,175
271
317
91.0
109.0
6.0
10.0
63.5
38.1
4.0
3.6
6.5
9.3
7.6
6.3
Metals & Mining
Coal India
Neutral
290
-
180,015
82,301
91,235
17.0
18.0
17.1
20.5
17.0
14.2
3.2
3.0
45.0
55.0
1.9
1.7
Hind. Zinc
Neutral
316
-
133,478
22,108
24,555
57.0
58.0
22.1
26.3
14.3
12.0
4.6
3.8
32.0
35.0
5.0
4.2
Hindalco
Neutral
269
-
60,331
102,350
105,355
13.5
14.5
21.5
24.5
12.5
11.0
1.7
1.5
15.0
15.2
1.2
1.1
JSW Steel
Neutral
259
-
62,666
64,500
68,245
21.1
21.5
20.1
21.2
12.9
12.2
2.4
2.0
-
-
1.7
1.6
NMDC
Neutral
121
-
38,283
10,209
11,450
47.0
48.0
11.1
12.1
10.9
10.0
1.5
1.4
-
-
3.3
3.0
SAIL
Neutral
62
-
25,421
54,100
63,555
3.0
10.0
(10.0)
1.5
41.0
0.8
0.8
-
-
1.5
1.3
Vedanta
Neutral
334
-
124,024
81,206
87,345
28.0
29.0
26.5
33.5
12.6
10.0
2.9
2.5
-
-
2.3
2.0
Tata Steel
Neutral
719
-
69,869
121,445
126,500
16.2
17.2
65.4
81.3
11.0
8.9
1.8
1.5
-
-
1.1
1.0
Oil & Gas
GAIL
Neutral
443
-
74,975
53,115
52,344
14.2
15.3
30.0
31.1
14.8
14.3
1.9
1.7
-
-
1.1
1.1
ONGC
Neutral
176
-
225,865
83,111
84,934
44.2
44.9
16.4
16.9
10.7
10.4
1.3
1.2
-
-
2.6
2.6
Indian Oil Corp
Neutral
407
-
197,805
396,116
432,560
8.5
8.8
40.1
42.2
10.2
9.7
1.8
1.6
-
-
0.6
0.6
Reliance Industries
Neutral
935
-
607,943
257,711
267,438
17.0
18.2
89.1
89.5
10.5
10.4
1.0
0.9
-
-
2.0
1.9
Pharmaceuticals
Alembic Pharma
Buy
492
600
9,271
3,903
4,584
18.2
19.2
21.8
27.2
22.6
18.1
4.1
3.4
19.8
20.6
2.4
2.0
Alkem Laboratories Ltd
Accumulate
1,861
2,079
22,250
6,320
7,341
17.5
19.8
72.7
96.6
25.6
19.3
4.5
3.8
16.7
18.7
3.5
2.9
Aurobindo Pharma
Accumulate
744
823
43,563
17,086
19,478
22.1
22.0
44.7
51.4
16.6
14.5
3.7
3.0
24.7
22.7
2.7
2.3
Aventis*
Neutral
4,220
-
9,719
2,508
2,862
16.8
16.8
139.9
153.8
30.2
27.4
4.4
3.6
23.5
25.8
3.5
2.9
Cadila Healthcare
Reduce
484
426
49,503
11,584
13,228
20.3
20.4
18.7
21.3
25.9
22.7
5.8
4.7
24.6
22.9
4.1
3.5
Cipla
Sell
595
458
47,899
16,619
19,437
15.4
16.2
19.7
24.3
30.2
24.5
3.4
3.1
12.0
13.2
3.0
2.6
Dr Reddy's
Neutral
2,363
-
39,175
15,844
17,973
17.6
18.2
91.7
111.0
25.8
21.3
2.9
2.6
11.9
13.0
2.7
2.4
GSK Pharma*
Neutral
2,447
-
20,727
3,260
3,651
15.0
18.0
46.1
58.6
53.1
41.8
10.9
11.3
20.0
26.5
6.3
5.7
Indoco Remedies
Sell
270
153
2,489
1,154
1,310
14.9
14.9
11.3
12.7
23.9
21.3
3.4
3.0
15.0
15.0
2.3
2.0
Stock Watch
October 25, 2017
Company Name
Reco
CMP
Target
Mkt Cap
Sales ( Čcr )
OPM(%)
EPS (Č)
PER(x)
P/BV(x)
RoE(%)
EV/Sales(x)
(Č)
Price ( Č)
( Č cr )
FY18E FY19E
FY18E
FY19E
FY18E
FY19E
FY18E
FY19E
FY18E
FY19E
FY18E
FY19E
FY18E
FY19E
Pharmaceuticals
Ipca labs
Accumulate
487
540
6,150
3,593
4,022
14.5
15.5
19.4
25.2
25.1
19.3
2.3
2.1
9.5
11.2
1.8
1.6
Lupin
Buy
1,027
1,467
46,377
18,657
21,289
21.3
23.3
52.8
66.7
19.4
15.4
2.9
2.5
16.3
17.5
2.5
2.1
Natco Pharma
Accumulate
978
1,057
17,045
1,886
2,016
32.3
29.5
23.2
22.0
42.2
44.4
8.8
7.8
20.9
17.6
8.9
8.3
Sun Pharma
Neutral
534
-
128,228
32,899
36,451
26.9
25.4
31.6
32.3
16.9
16.6
3.0
2.6
18.7
18.8
3.5
3.0
Syngene International
Accumulate
500
557
10,000
1,402
1,823
32.8
36.0
15.9
20.7
31.5
24.2
5.9
4.8
18.7
20.0
7.1
5.5
Power
Tata Power
Neutral
82
-
22,206
32,547
33,806
20.5
20.5
4.7
5.4
17.5
15.4
1.7
1.4
10.5
10.5
1.7
1.6
NTPC
Neutral
182
-
149,779
86,070
101,246
28.3
30.7
12.9
16.2
14.1
11.2
1.5
1.3
10.6
12.4
3.1
2.8
Power Grid
Neutral
215
-
112,348
29,183
32,946
89.7
90.0
18.0
20.8
12.0
10.3
2.0
1.8
17.7
18.2
7.8
7.2
Real Estate
Prestige Estate
Neutral
289
-
10,830
4,607
5,146
21.0
22.2
7.9
9.8
36.6
29.5
2.3
2.1
10.3
12.0
3.5
3.2
MLIFE
Accumulate
464
522
2,381
487
590
12.3
17.8
21.0
31.2
22.1
14.9
1.2
1.1
5.2
7.4
3.6
2.9
Telecom
Bharti Airtel
Neutral
502
-
200,530
97,903
105,233
36.0
36.3
9.3
11.1
53.9
45.4
2.6
2.5
5.0
5.6
3.0
2.7
Idea Cellular
Neutral
98
-
35,509
35,012
37,689
27.1
27.7
(4.4)
(2.7)
1.5
1.6
(6.8)
(4.6)
2.3
2.1
zOthers
Abbott India
Neutral
4,208
-
8,942
3,244
3,723
14.9
16.1
167.5
209.4
25.1
20.1
5.5
4.6
23.7
24.8
2.4
2.0
Asian Granito
Buy
492
570
1,481
1,169
1,286
12.5
12.5
16.0
19.7
30.8
25.0
3.3
2.9
10.7
11.6
1.5
1.3
Bajaj Electricals
Neutral
388
-
3,943
4,646
5,301
6.7
7.6
16.1
22.3
24.1
17.4
3.9
3.4
16.4
19.2
0.8
0.7
Banco Products (India)
Neutral
215
-
1,541
1,530
1,695
13.2
12.7
19.0
20.0
11.3
10.8
1.8
1.6
0.2
0.2
0.9
101.8
Coffee Day Enterprises
Neutral
221
-
4,557
3,494
3,913
17.4
18.0
4.8
5.7
-
38.8
2.0
1.9
-
0.1
1.8
1.5
Ltd
Elecon Engineering
Neutral
68
-
762
171
201
15.0
16.2
36.0
43.0
1.9
1.6
0.2
0.2
0.1
0.1
3.8
3.3
Garware Wall Ropes
Neutral
902
-
1,973
928
1,003
15.2
15.2
39.4
43.2
22.9
20.9
3.8
3.2
16.5
15.4
2.0
1.8
Goodyear India*
Neutral
811
-
1,870
1,717
1,866
11.8
12.3
47.9
49.8
16.9
16.3
2.6
2.3
15.6
15.7
0.8
112.3
Hitachi
Neutral
2,516
-
6,842
2,355
2,715
10.3
10.8
49.0
60.9
51.4
41.3
12.0
9.5
0.2
0.2
2.9
2.5
HSIL
Neutral
425
-
3,069
2,240
2,670
14.6
15.0
17.0
22.0
25.0
19.3
2.1
2.0
0.1
0.1
1.6
1.3
Interglobe Aviation
Neutral
1,168
-
42,234
22,570
27,955
14.2
15.0
63.6
81.8
18.4
14.3
9.7
8.2
0.5
0.6
1.6
1.2
Jyothy Laboratories
Neutral
378
-
6,867
1,781
2,044
14.1
15.0
9.4
10.5
40.4
36.0
8.6
8.1
0.2
0.2
4.1
3.5
Linc Pen & Plastics
Neutral
240
-
355
420
462
9.3
9.3
15.3
17.1
15.7
14.0
2.7
2.7
16.9
19.5
0.9
0.8
M M Forgings
Neutral
868
-
1,048
542
642
20.1
21.0
41.6
56.8
20.9
15.3
2.9
2.4
0.1
0.2
2.3
2.0
Mirza International
Neutral
158
-
1,900
1,148
1,285
18.0
18.0
8.0
9.4
19.6
16.9
3.3
2.8
16.3
16.1
1.8
1.6
Navkar Corporation
Buy
198
265
2,819
561
617
41.5
41.5
11.5
12.7
17.2
15.6
1.8
1.6
10.5
10.4
5.7
5.0
Nilkamal
Neutral
1,609
-
2,401
2,317
2,525
11.4
11.1
96.0
105.0
16.8
15.3
2.8
2.5
0.2
0.2
1.0
0.9
Stock Watch
October 25, 2017
Company Name
Reco
CMP
Target Mkt Cap
Sales ( Čcr )
OPM(%)
EPS (Č)
PER(x)
P/BV(x)
RoE(%)
EV/Sales(x)
(Č)
Price ( Č)
( Č cr )
FY18E FY19E FY18E FY19E FY18E FY19E FY18E FY19E FY18E FY19E FY18E FY19E FY18E FY19E
zOthers
Parag Milk Foods
Neutral
275
-
2,317
1,987
2,379
7.6
9.0
12.4
18.3
22.2
15.1
3.1
2.7
8.2
13.2
1.3
1.1
Radico Khaitan
Neutral
221
-
2,939
1,811
1,992
13.2
13.2
8.1
8.8
27.3
25.1
2.8
3.0
10.1
12.0
2.0
1.8
Relaxo Footwears
Neutral
512
-
6,147
1,981
2,310
13.7
14.5
12.0
15.5
42.6
33.0
8.3
6.7
0.2
0.2
3.2
2.7
Siyaram Silk Mills
Accumulate
2,792
2,982
2,617
1,769
1,981
12.7
12.7
113.1
131.1
24.7
21.3
3.8
3.3
15.5
15.5
1.7
1.5
Styrolution ABS India* Neutral
1,002
-
1,761
1,800
1,980
8.0
8.1
42.0
46.2
23.9
21.7
2.7
2.4
0.1
0.1
1.1
1.0
Surya Roshni
Neutral
326
-
1,430
4,870
5,320
7.7
7.8
22.8
28.1
14.4
11.6
1.9
1.7
0.1
0.1
0.5
0.5
TVS Srichakra
Neutral
3,101
-
2,375
2,729
2,893
12.7
12.5
248.5
265.0
12.5
11.7
3.5
2.9
0.3
0.3
0.9
0.8
Visaka Industries
Neutral
694
-
1,101
1,104
1,214
12.1
12.6
31.0
37.9
22.4
18.3
2.7
2.4
0.1
0.1
1.2
1.1
VIP Industries
Accumulate
271
300
3,825
1,450
1,693
10.4
10.5
6.5
7.8
41.4
34.7
8.7
7.6
21.1
22.1
2.6
2.2
Navin Fluorine
Neutral
709
-
3,493
945
1,154
22.4
22.6
28.7
34.8
24.7
20.4
4.1
3.5
-
-
3.2
2.5
Source: Company, Angel Research; Note: *December year end; #September year end; &October year end; Price as on October 24, 2017
Market Outlook
October 25, 2017
Research Team Tel: 022 - 39357800
DISCLAIMER
Angel Broking Private Limited (hereinafter referred to as “Angel”) is a registered Member of National Stock Exchange of India
Limited,Bombay Stock Exchange Limited and Metropolitan Stock Exchange Limited. It is also registered as a Depository Participant with
CDSL and Portfolio Manager with SEBI. It also has registration with AMFI as a Mutual Fund Distributor. Angel Broking Private Limited is a
registered entity with SEBI for Research Analyst in terms of SEBI (Research Analyst) Regulations, 2014 vide registration number
INH000000164. Angel or its associates has not been debarred/ suspended by SEBI or any other regulatory authority for accessing
/dealing in securities Market. Angel or its associates/analyst has not received any compensation / managed or
co-managed public offering of securities of the company covered by Analyst during the past twelve months.
This document is solely for the personal information of the recipient, and must not be singularly used as the basis of any investment
decision. Nothing in this document should be construed as investment or financial advice. Each recipient of this document should make
such investigations as they deem necessary to arrive at an independent evaluation of an investment in the securities of the companies
referred to in this document (including the merits and risks involved), and should consult their own advisors to determine the merits and
risks of such an investment.
Reports based on technical and derivative analysis center on studying charts of a stock's price movement, outstanding positions and
trading volume, as opposed to focusing on a company's fundamentals and, as such, may not match with a report on a company's
fundamentals. Investors are advised to refer the Fundamental and Technical Research Reports available on our website to evaluate the
contrary view, if any.
The information in this document has been printed on the basis of publicly available information, internal data and other reliable
sources believed to be true, but we do not represent that it is accurate or complete and it should not be relied on as such, as this
document is for general guidance only. Angel Broking Pvt. Limited or any of its affiliates/ group companies shall not be in any way
responsible for any loss or damage that may arise to any person from any inadvertent error in the information contained in this report.
Angel Broking Pvt. Limited has not independently verified all the information contained within this document. Accordingly, we cannot
testify, nor make any representation or warranty, express or implied, to the accuracy, contents or data contained within this document.
While Angel Broking Pvt. Limited endeavors to update on a reasonable basis the information discussed in this material, there may be
regulatory, compliance, or other reasons that prevent us from doing so.
This document is being supplied to you solely for your information, and its contents, information or data may not be reproduced,
redistributed or passed on, directly or indirectly.
Neither Angel Broking Pvt. Limited, nor its directors, employees or affiliates shall be liable for any loss or damage that may arise from
or in connection with the use of this information.